How a small reef in the Kuroshio Current nourishes the surrounding ocean
Vertical nitrate fluxes associated with flow–topography interactions around a small reef in the Kuroshio Current are quantified using state-of-the-art oceanographic instruments. When the flow passes over a shallow sill on the flank of the reef, the velocity differences between layers intensify, resulting in a substantial vertical overturning and mixing of the water column. This turbulent mixing causes the observed nitrate flux from deep water to reach a value which is among the highest observed worldwide.
Vertical nitrate fluxes associated with turbulent mixing and upwelling around a small reef in the Kuroshio are quantified by continuously deploying a turbulence microstructure profiler with an attached submersible ultraviolet nitrate analyzer while drifting from the upstream to the downstream of the reef. Flow separations and trains of Kelvin–Helmholtz billows (altitude = 60 m) are identified using a shipboard ADCP and an echo-sounder. The turbulence diffusivity associated with the vigorous turbulent mixing reaches up to O(10−1 m2 s−1), resulting in strong nitrate fluxes of O(1 to 103 mmol m−2 day−1). In addition, large differences between the upstream and downstream density profiles suggest a strong upwelling velocity of O(10−3 m s−1), as well as an upwelling nitrate flux of O(102 mmol m−2 day−1) in the entire subsurface layer.
Reference URL: https://doi.org/10.1029/2020GL092063
Bibliographic Information
How a small reef in the Kuroshio cultivates the ocean, Daisuke Hasegawa, Takeshi Matsuno, Eisuke Tsutsumi, Tomoharu Senjyu, Takahiro Endoh, Takahiro Tanaka, Naoki Yoshie, Hirohiko Nakamura, Ayako Nishina, Toru Kobari, Takeyoshi Nagai, and Xinyu Guo, Geophysical Research Letters, doi: 10.1029/2020GL092063, 2021 (February 25).
Fundings
- Japan Society for the Promotion of Science(JSPS) KAKENHI Grant Number JP15H05818, JP15H05821, JP18H04914, JP16H01590, JP18H04920, JP18H04917
Media
-
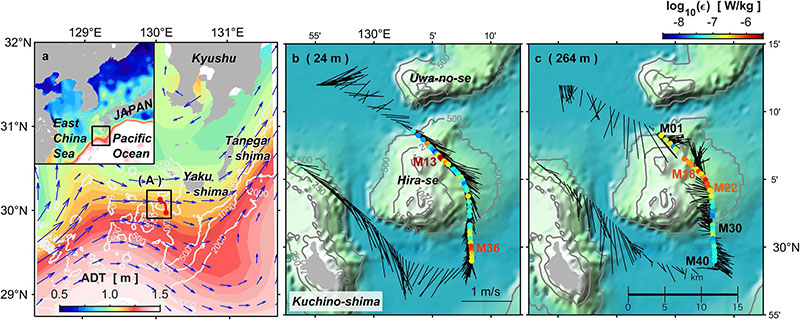
Location and Kuroshio Current around the sea mountain Hira-se in Tokara Strait, southwest of Kyushu, Japan
Figure 1. (a) Absolute Dynamics Topography (color scale in meters) around Tokara Strait, southwest of Kyushu, Japan, on November 16, 2016. The inset map shows the surrounding area of the study region. The white lines indicate bathymetry. The blue arrows indicate the geostrophic current based on satellite altimetry, with arrows plotted only where the velocity exceeds 0.2 m s−1. (b and c) Enlarged map showing bathymetry around Hira-se (the area indicated by (A) in panel (a)) with current vectors based on observations by the shipboard ADCP for depths of (b) 24 m and (c) 264 m. The colored circles indicate a depth-averaged turbulent dissipation rate in (b) the subsurface layer and (c) the intermediate layer.
credit : Daisuke Hasegawa, Fisheries Resources Institute, Japan Fisheries Research and Education Agency (FRA), Shiogama, Japan
Usage Restriction : Please contact us if you use any figures. -
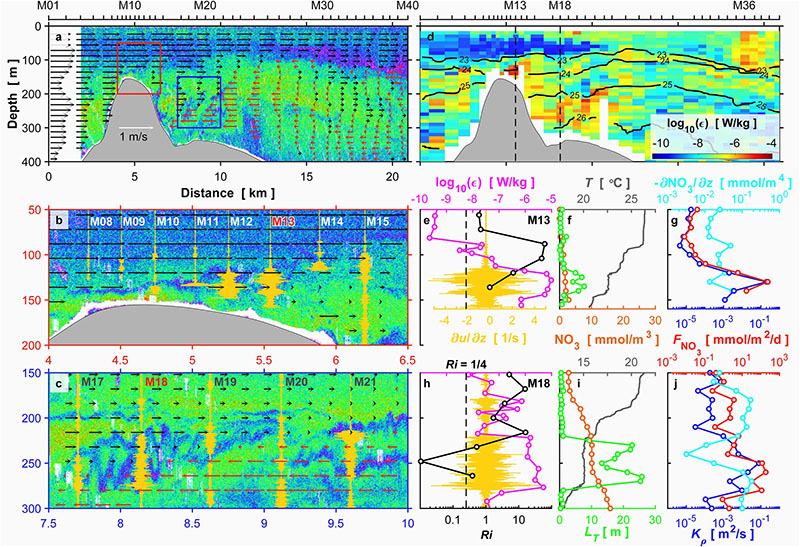
Echogram with along-stream velocity and turbulent strength around the sea mountain Hira-se
Figure 2. (a) Echogram (120 kHz) with an along-stream velocity profile during the drifting survey along the flow over a sill at the northeast flank of Hira-se (see Figure 1 for the location). The red arrows indicate recirculation flow. (b and c) Detailed echograms corresponding respectively with the red and blue boxes in (a). The thorny yellow lines represent microstructure shear profiles based on observations by TurboMAP-L. (d) Vertical section of the turbulent kinetic energy dissipation rate. Black contours represent isopycnals. (e–j) Vertical profiles of microstructure shear (yellow), turbulent kinetic energy dissipation rates (magenta), gradient Richardson number (Ri; black), temperature (gray), Thorpe scale (green), nitrate concentration (orange), vertical gradient of nitrate concentration (cyan), vertical diffusivity (blue), and vertical turbulent nitrate flux (red) for (e–g) station M13 and (h–j) station M18. The dashed black lines in (e) and (h) indicate the Ri = 0.25 critical value.
credit : Daisuke Hasegawa, Fisheries Resources Institute, Japan Fisheries Research and Education Agency (FRA), Shiogama, Japan
Usage Restriction : Please contact us if you use any figures. -
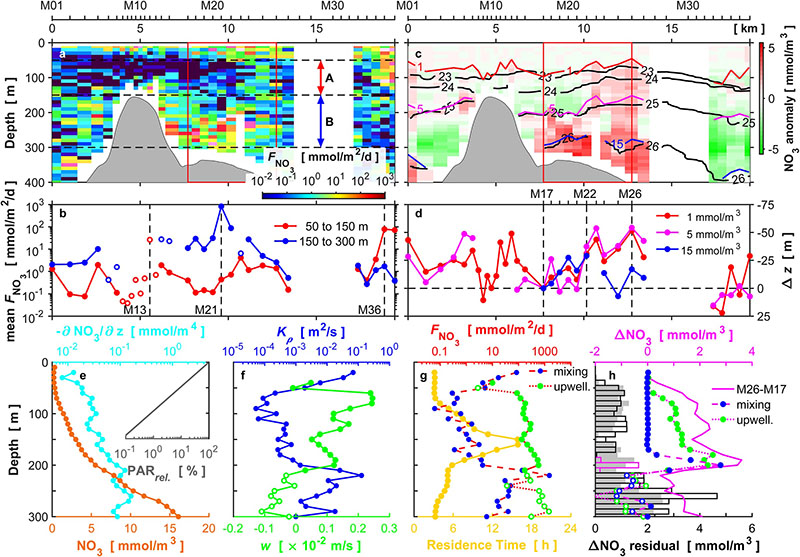
Turbulent vertical nitrate flux around the sea mountain Hira-se
Figure 3. (a) Turbulent vertical nitrate flux during the drifting survey. Nitrate data are missing for stations M28 through M32 due to battery failure. (b) Averaged turbulent vertical nitrate flux in the subsurface layer (red circles; the layer marked as A in (a)) and in the intermediate layer (blue circles; the layer marked as B in (a)). Open circles indicate stations where the profiling depth did not fully cover the averaging layers. (c) Nitrate concentration anomaly along the drifting survey. Black contours represent isopycnals. Red, magenta, and blue lines indicate 1, 5, and 15 mmol m−3 nitrate isolines; corresponding isoline depths for the section are plotted in (d). (e–g) Averaged profiles between stations M17 and M26 (region in red box in (a)) for nitrate concentrations (orange in e), relative irradiance (gray in e), vertical gradient of nitrate concentration (cyan in e), vertical diffusivity (blue in f), vertical velocity estimated based on the change in the density profile (green in f), turbulent vertical nitrate flux (the dashed red line with the blue circles in g), upwelling nitrate flux (the dotted red line with the green circles in g), and residence time (yellow in g). Observed nitrate increase from M17 to M26 (the solid magenta line in h), estimated nitrate increase by the turbulent mixing (the dashed magenta line with the blue circles in h), estimated nitrate increase by the upwelling (the dotted magenta line with the green circles in h), residual part of the nitrate increase which cannot be explained by the sum of the observed turbulent mixing and estimated upwelling (the black-edged bars in h; the magenta-edged bar indicates a negative value), and nitrate increase along the isopycnal surfaces (the gray bars in h). The open circles in the figures (f–h) indicate negative values.
credit : Daisuke Hasegawa, Fisheries Resources Institute, Japan Fisheries Research and Education Agency (FRA), Shiogama, Japan
Usage Restriction : Please contact us if you use any figures.
Contact Person
Name : Naoki Yoshie
Phone : +81-89-927-9839
E-mail : yoshie.naoki.mm@ehime-u.ac.jp
Affiliation : Center for Marine Environmental Studies