Changes in the Kuroshio path, surface velocity and transport during the last 35,000 years

Ocean modeling suggests that the North Equatorial Current as well as the Kuroshio was stronger during the last glacial period than at present.
Southward migration of the Kuroshio Extension during the last glacial period was between 0.5 and 3.5° depending on the longitudes.
Model results indicate that the vertical thermal gradient in the upper ocean is not a suitable indicator of the Kuroshio intensity.
The last glacial age was characterized by millennial-scale climate variations and sea-level changes. Although the path and intensity of the Kuroshio during the last glacial age have been studied extensively, the evolution of the Kuroshio is still poorly understood because of limited observations and incomplete model configurations. Using an improved ocean model and paleoclimate air–sea forcing field, we simulated the changes in the Kuroshio Current (KC) and Kuroshio Extension (KE) at 5 ages from 35,000 years ago to the present.
The annual mean Kuroshio axis for the five ages is defined by the maximum velocity along the Kuroshio (image 1d, Ambe et al., 2004). Model results show that the glacial Kuroshio transport increases and the KC axis migrates slightly seaward in the East China Sea (ECS). The glacial KC appears to shift southward when it exits the ECS through the Tokara Strait, and exhibits the southernmost shift during the Last Glacial Maximum (LGM; ~21 ka BP). Moreover, the glacial KC off the southeastern coast of Japan migrates northward with a small meander. The southward migration of the glacial KE varies between 0.5 and 3.5°.
To quantify the subtropical circulation changes in of the five ages, we zonally integrated the volume transport from the east coast to 137 °E (See Additional information 1) for the annual mean transport stream function at different latitudes (solid lines in image 2). The North Pacific subtropical gyre tendeds to be stronger and shifteds southward in during glacial ages. We also calculated the corresponding wind-driven Sverdrup transport from the east coast to 137 °E (dashed lines in image 2, see Additional information 2). From 13 to 25 °N, the wind-driven Sverdrup transport agreeds with gyre strengthening in the glacial ages. However, the Sverdrup transport north of 25 °N wais weaker in the glacial ages than at 0 and 6 ka BP, which wais not consistent with gyre strengthening (image 2). A significant amount of cooling is was evident over the Kuroshio region during the glacial ages in our model forcing. According to the suggestion of Hogg and Gayen (2020), it is possible that the circulation north of 25 °N wais driven by the buoyancy forcing rather than the wind stresses.
The KC intensity strongly affects the Okinawa Trough water temperatures. For the reconstructed Okinawa Trough water temperatures, the U_37^(K^’ ) proxy is usually used as an annual mean SST index (Kim et al., 2015) and the TEX_86 proxy most likely reflects subsurface (i.e., < 200 m) water temperature(Li et al., 2013; Ruan et al., 2017). The vertical thermal gradient can be estimated from the difference between U_37^(K^' ) and TEX_86 derived temperature, i.e., 〖ΔΤ=SST〗_(U_37^K' )-SubST_(TEX_86 ); hence, ∆T has been used as an indicator of the KC intensity and evolution. We compared the modeled annual mean ∆T and the modeled surface-current speeds at the two core sites (image 3). According to image 3, a stronger KC appears to correspond with a higher ∆T but not a lower ∆T. The idea that a stronger KC results in a lower ∆T value is not compatible with ocean dynamics. we We calculated the difference between the modeled subsurface (i.e., 200 m) water temperature (i.e., ΔTH = SubSTDGKS9603 - SubSTDGKS9604) between the DGKS9604 and DGKS9603 cores (image 1d). The ΔTH values are were 0.49, 0.50, 2.39, 2.00, and 1.49 ℃ at 0, 6 ka BP, LGM, 30 and 35 ka BP, respectively. The maximum current speeds in the upper 200 m are were 0.92, 0.93, 1.47, 1.44, and 1.40 m/s at 0, 6 ka BP, LGM, 30 and 35 ka BP, respectively. There was a significant correlation between ΔTH and KC speeds; therefore, it is practical to evaluate the KC surface strength by using the horizontal subsurface temperature gradient across the KC.
【References】
Ambe, D., Imawaki, S., Uchida, H., & Ichikawa, K. (2004). Estimating the Kuroshio Axis South of Japan Using Combination of Satellite Altimetry and Drifting Buoys. Journal of Oceanography, 60(2), 375–382.
Hogg, A. McC., & Gayen, B. (2020). Ocean Gyres Driven by Surface Buoyancy Forcing. Geophysical Research Letters, 47(16).
Kim, R. A., Lee, K. E., & Bae, S. W. (2015). Sea surface temperature proxies (alkenones, foraminiferal Mg/Ca, and planktonic foraminiferal assemblage) and their implications in the Okinawa Trough. Progress in Earth and Planetary Science, 2(1), 43.
Li, D., Zhao, M., Tian, J., & Li, L. (2013). Comparison and implication of TEXH86 and UK´37 temperature records over the last 356 kyr of ODP Site 1147 from the northern South China Sea. Palaeogeography, Palaeoclimatology, Palaeoecology, 376, 213–223.
Ruan, J., Xu, Y., Ding, S., Wang, Y., & Zhang, X. (2017). A biomarker record of temperature and phytoplankton community structure in the Okinawa Trough since the last glacial maximum. Quaternary Research, 88(1), 89–97.
Additional information 1
Based on the annual mean current, the upper 1000-m integrated volume transport stream function was calculated as Ψ(x,y)=∫_(x_E)^x▒∫_(-1000 m)^0▒v(x,y,z)dzdx, where Ψ is the stream function, x_E denotes the eastern boundary of the Pacific, and v(x,y,z) is the northward velocity at the point with x, y, and z (i.e., longitude, latitude, and depth, respectively) coordinates.
Additional information 2
Large-scale upper ocean circulation is mainly driven by wind stress. The Sverdrup balance relates the meridional mass transport (i.e., the Sverdrup transport) to the wind-stress curl (Sverdrup, 1947). Using this relation, we calculated the Sverdrup-transport stream function Ψ by integrating the wind-stress curl from the eastern boundary (x_E) at a different latitude (y) as Ψ(x,y)=-1/(ρ_0 β) ∫_x^(x_E)▒〖∇×τ dx〗+Ψ(x_E,y), where β is the meridional gradient of the Coriolis parameter, ρ_0 is water density (i.e., 1025 kg/m3), x is longitude, τ=(τ_x,τ_y ) is the wind stress vector, and Ψ(x_E,y) is zero at the east boundary.
Reference URL: https://agupubs.onlinelibrary.wiley.com/doi/full/10.1029/2021GL097250
Bibliographic Information
Changes in the Kuroshio path, surface velocity and transport during the last 35,000 years, Haiyan Yang, Xinyu Guo, Yasumasa Miyazawa, Sergey M. Varlamov, Ayako Abe-Ouchi, Wing-Le Chan. Geophysical Research Letters, 49, e2021GL097250. https://doi.org/10.1029/2021GL097250 (February 28).
Fundings
- Japan Society for the Promotion of Science (JSPS) KAKENHI Grant Number 17H02959, 17H06104 and 17H06323
Media
-
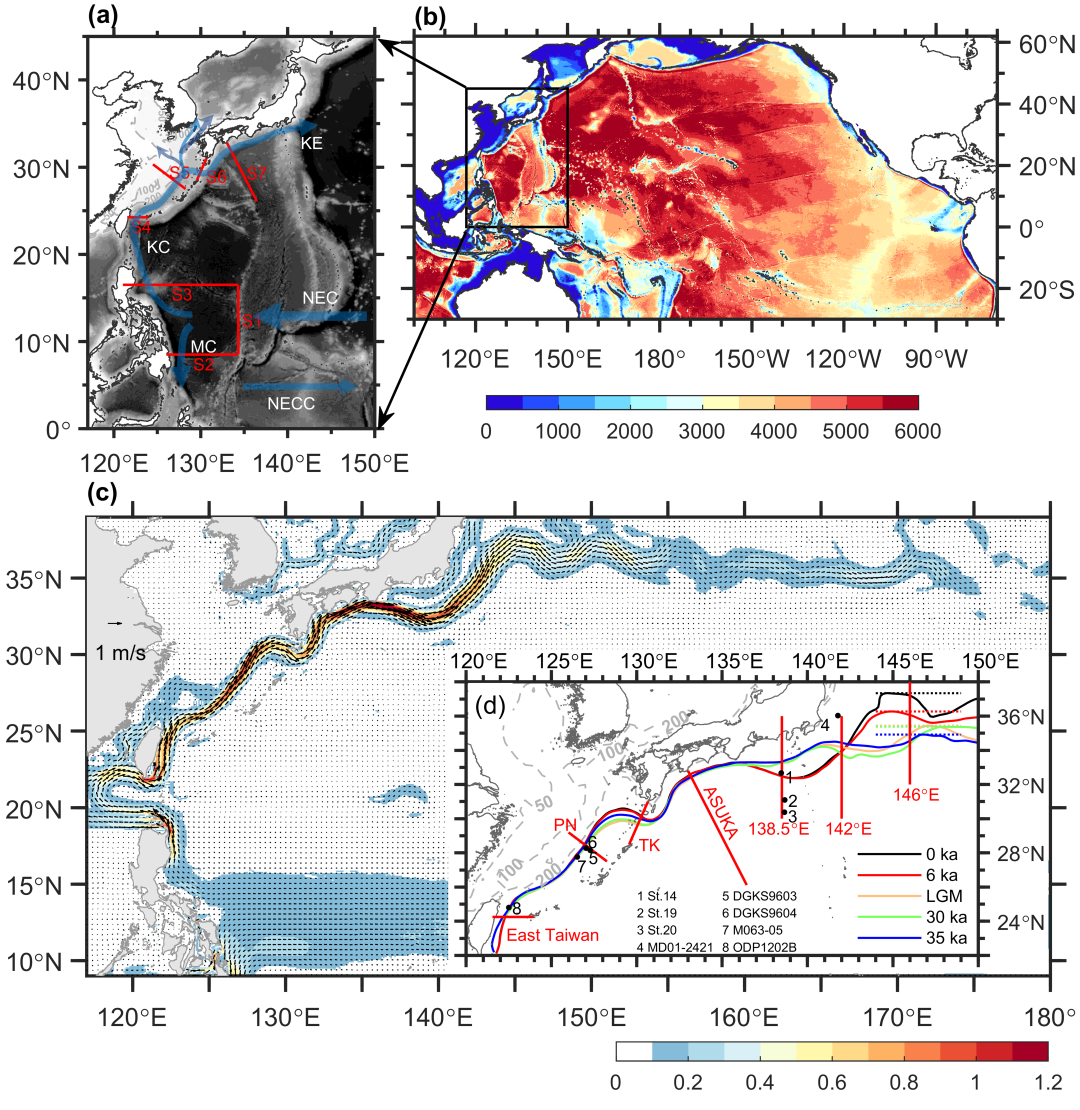
Model bathymetry and Kuroshio axes in five different experiments.
(a) Northwest Pacific Ocean bathymetry (shaded colors; unit: m) and ocean circulation (semitransparent blue arrows) map. Red lines indicate sections used for volume transports in Table S2. The NEC, NECC, MC, KC, and KE acronyms stand for North Equatorial Current, North Equatorial Countercurrent, Mindanao Current, Kuroshio Current, and Kuroshio Extension, respectively. (b) Domain and bathymetry of the model. Colors indicate model bathymetry (unit: m). (c) Annual mean surface current (0-100 m, unit: m/s) in the Northwest Pacific. Shading indicates the area where current speed exceeds 0.1 m/s. (d) Kuroshio axes in five different experiments. Gray dotted lines indicate the East China Sea depths; other dotted lines indicate the northern KE limits. Red lines indicate sections for checking the velocity cores and water temperatures. Black circles (from 1 to 8) are the sediment cores used in our discussion.
credit : Xinyu Guo, Ehime University
Usage Restriction : Please get copyright permission -
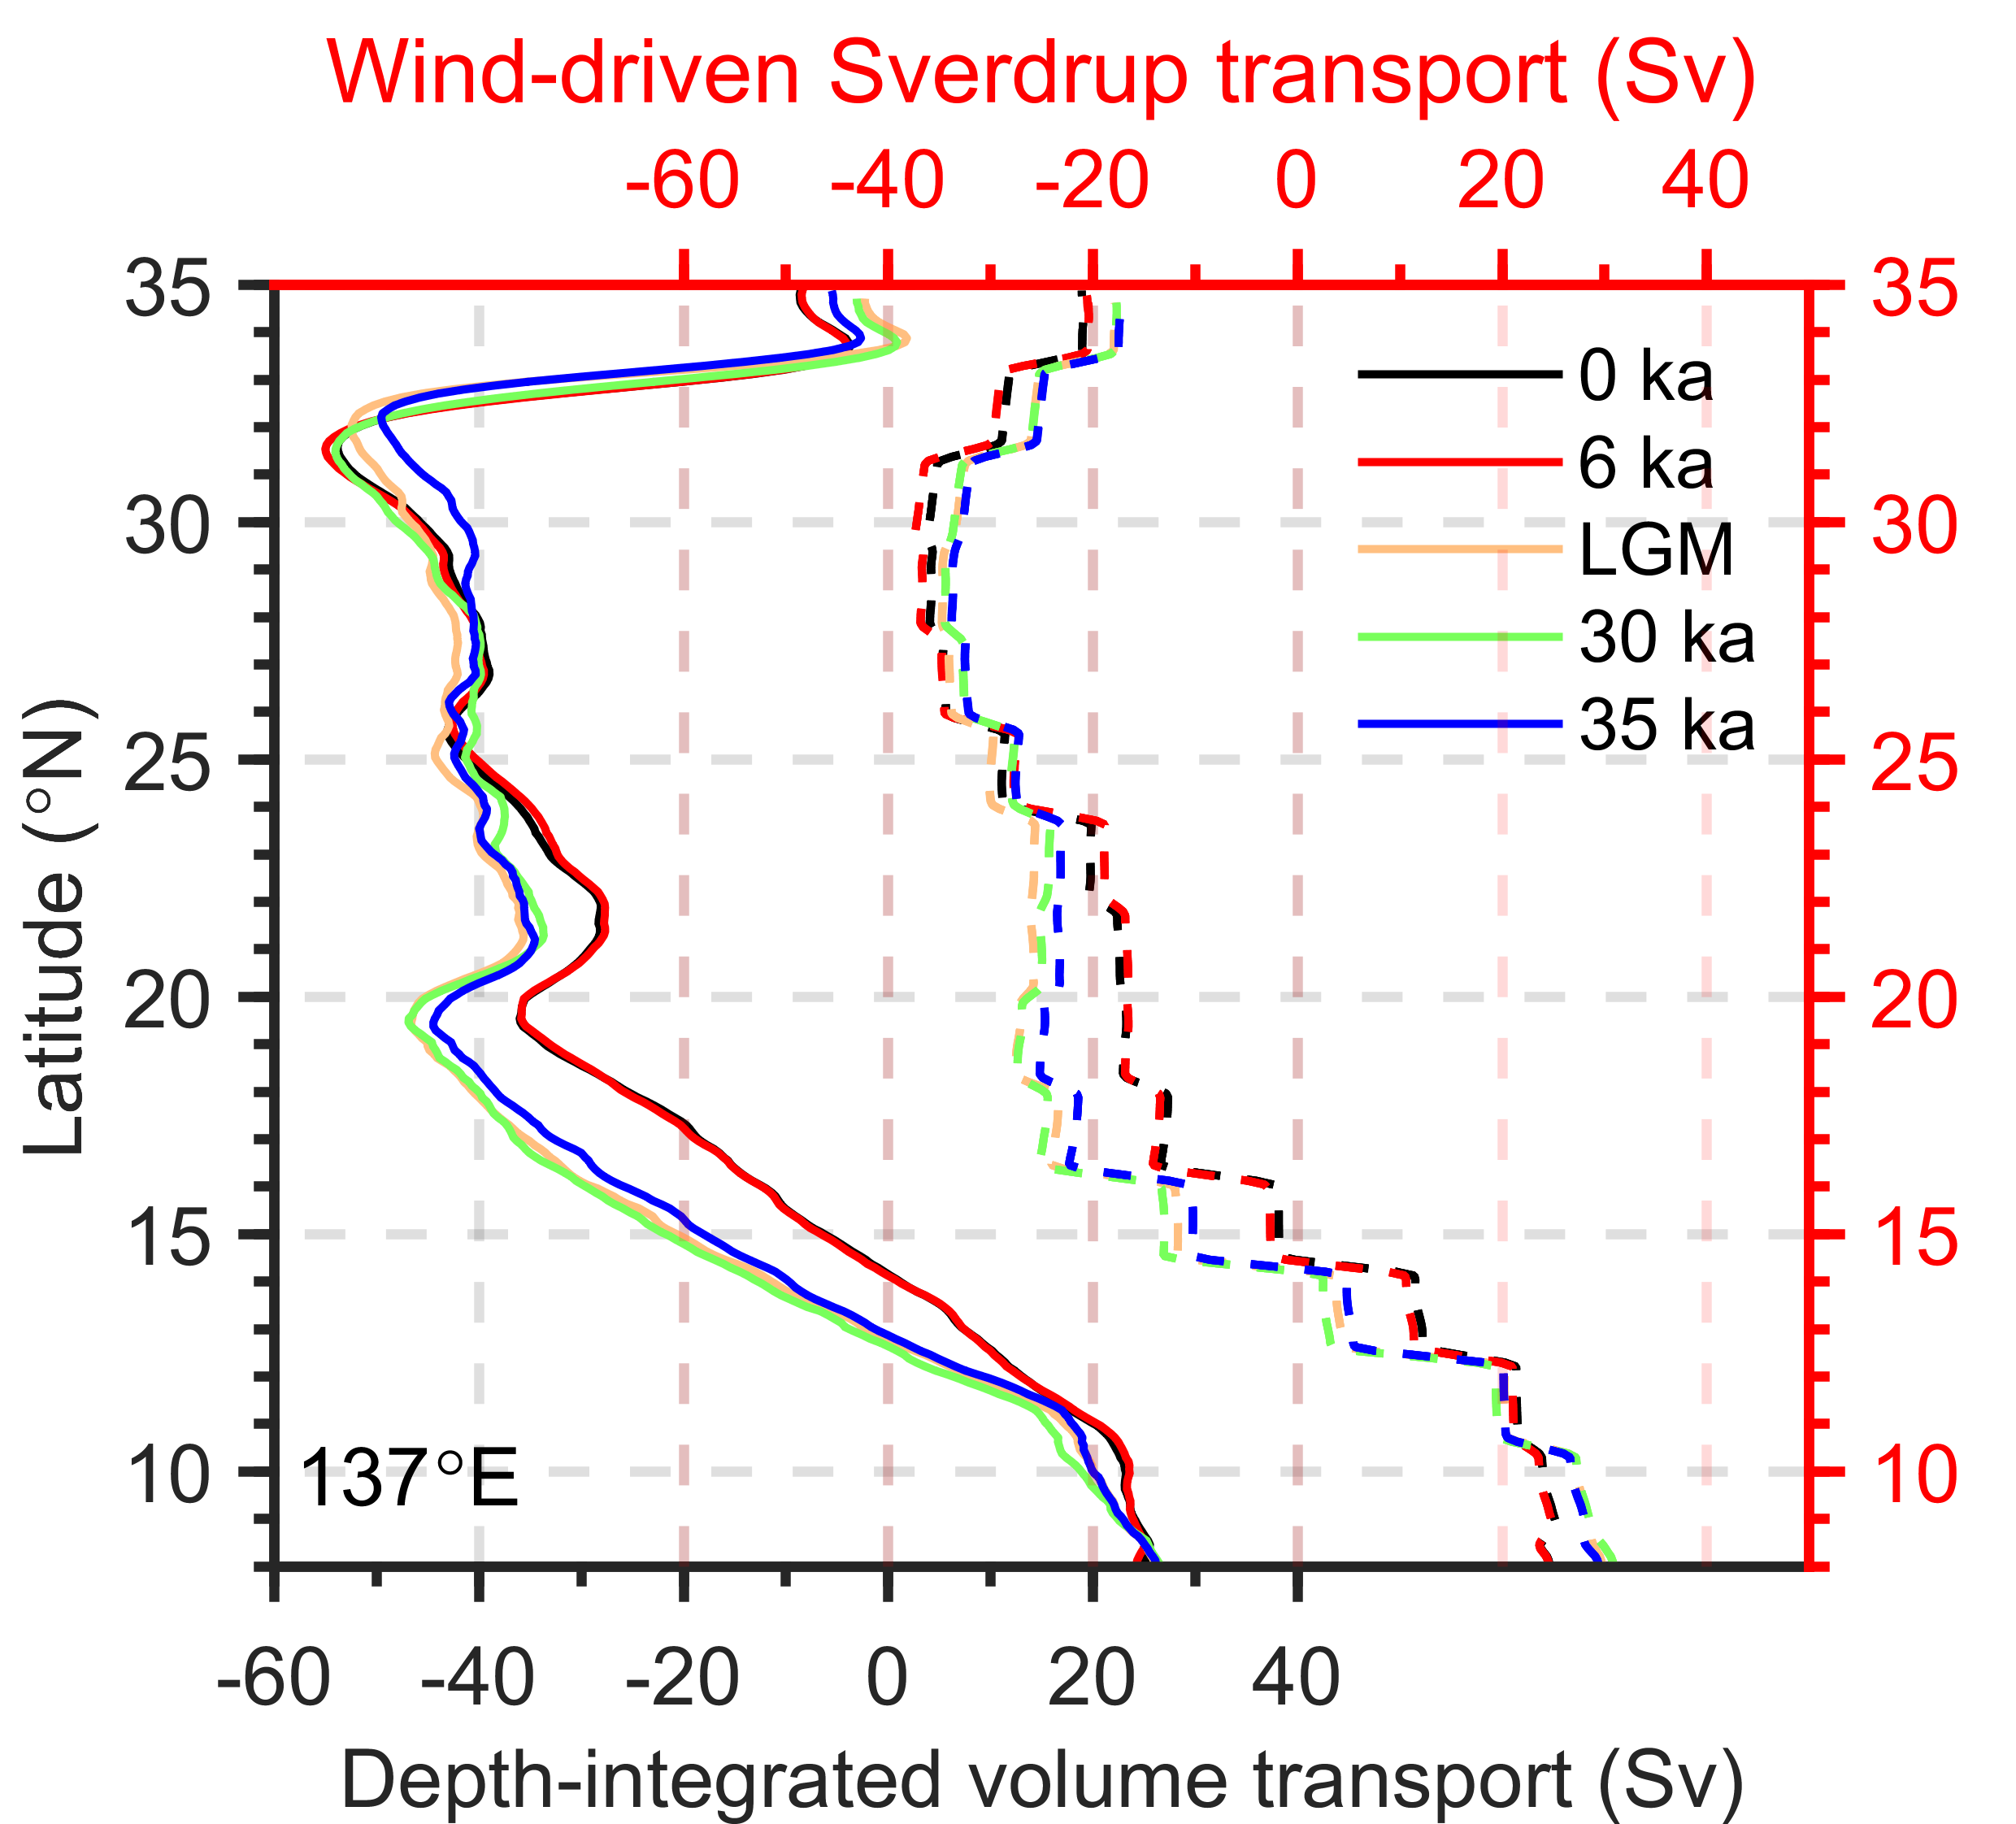
Depth-integrated volume transport and wind-driven Sverdrup transport from the east coast to 137 °E
Zonally integrated values in Sv from the east coast to 137 °E of modeled volume transport in the upper 1000 m (solid lines, with reference to the black axes) and wind-driven Sverdrup transport from the east coast to 137 °E (dashed lines, with reference to the red axes). All the values are processed with a 0.25 degree running average.
credit : Xinyu Guo, Ehime University
Usage Restriction : Please get copyright permission -
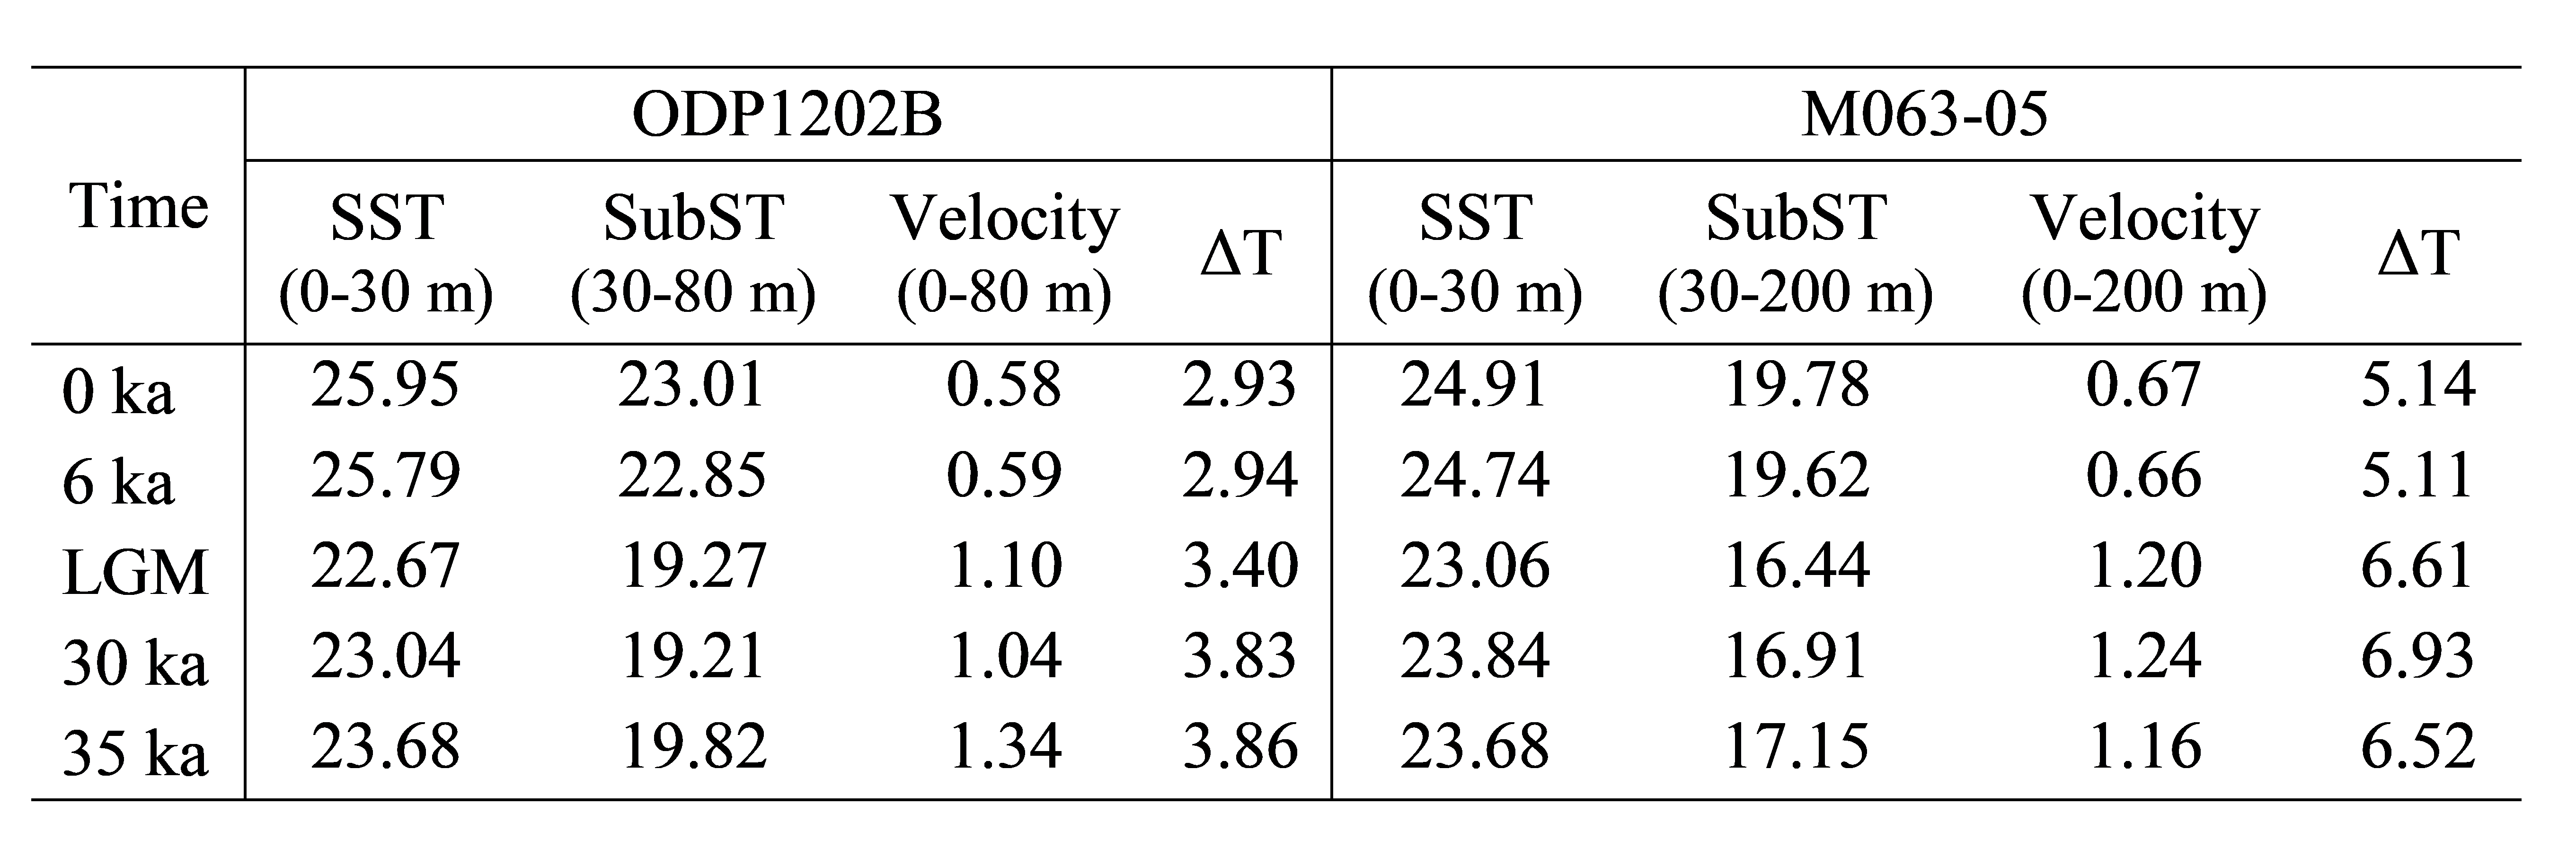
Modeled sea surface temperature (SST), subsurface temperature (SubST), their difference (i.e., ΔT = SST – SubST; unit: ℃), and surface velocity (unit: m/s) at the ODP1202B and M063-05 sediment cores.
The depth of SubST at the ODP1202B core is from Ruan et al. (2017) while that at the M063-05 core is from Li et al. (2020).
credit : Xinyu Guo, Ehime University
Usage Restriction : Please get copyright permission
Contact Person
Name : Xinyu Guo
Phone : +81-89-927-9824
E-mail : guo.xinyu.mz@ehime-u.ac.jp
Affiliation : Center for Marine Environmental Studies (CMES)